> ## Documentation Index
> Fetch the complete documentation index at: https://dify-6c0370d8-add-new-agent.mintlify.site/llms.txt
> Use this file to discover all available pages before exploring further.
# 仪表盘
> 通过 Dify 内置的分析仪表盘监控性能、成本和用户参与度
⚠️ 本文档由 AI 自动翻译。如有任何不准确之处,请参考[英文原版](/en/use-dify/monitor/analysis)。
该仪表盘随时间跟踪四个指标,以展示你的应用程序的表现:
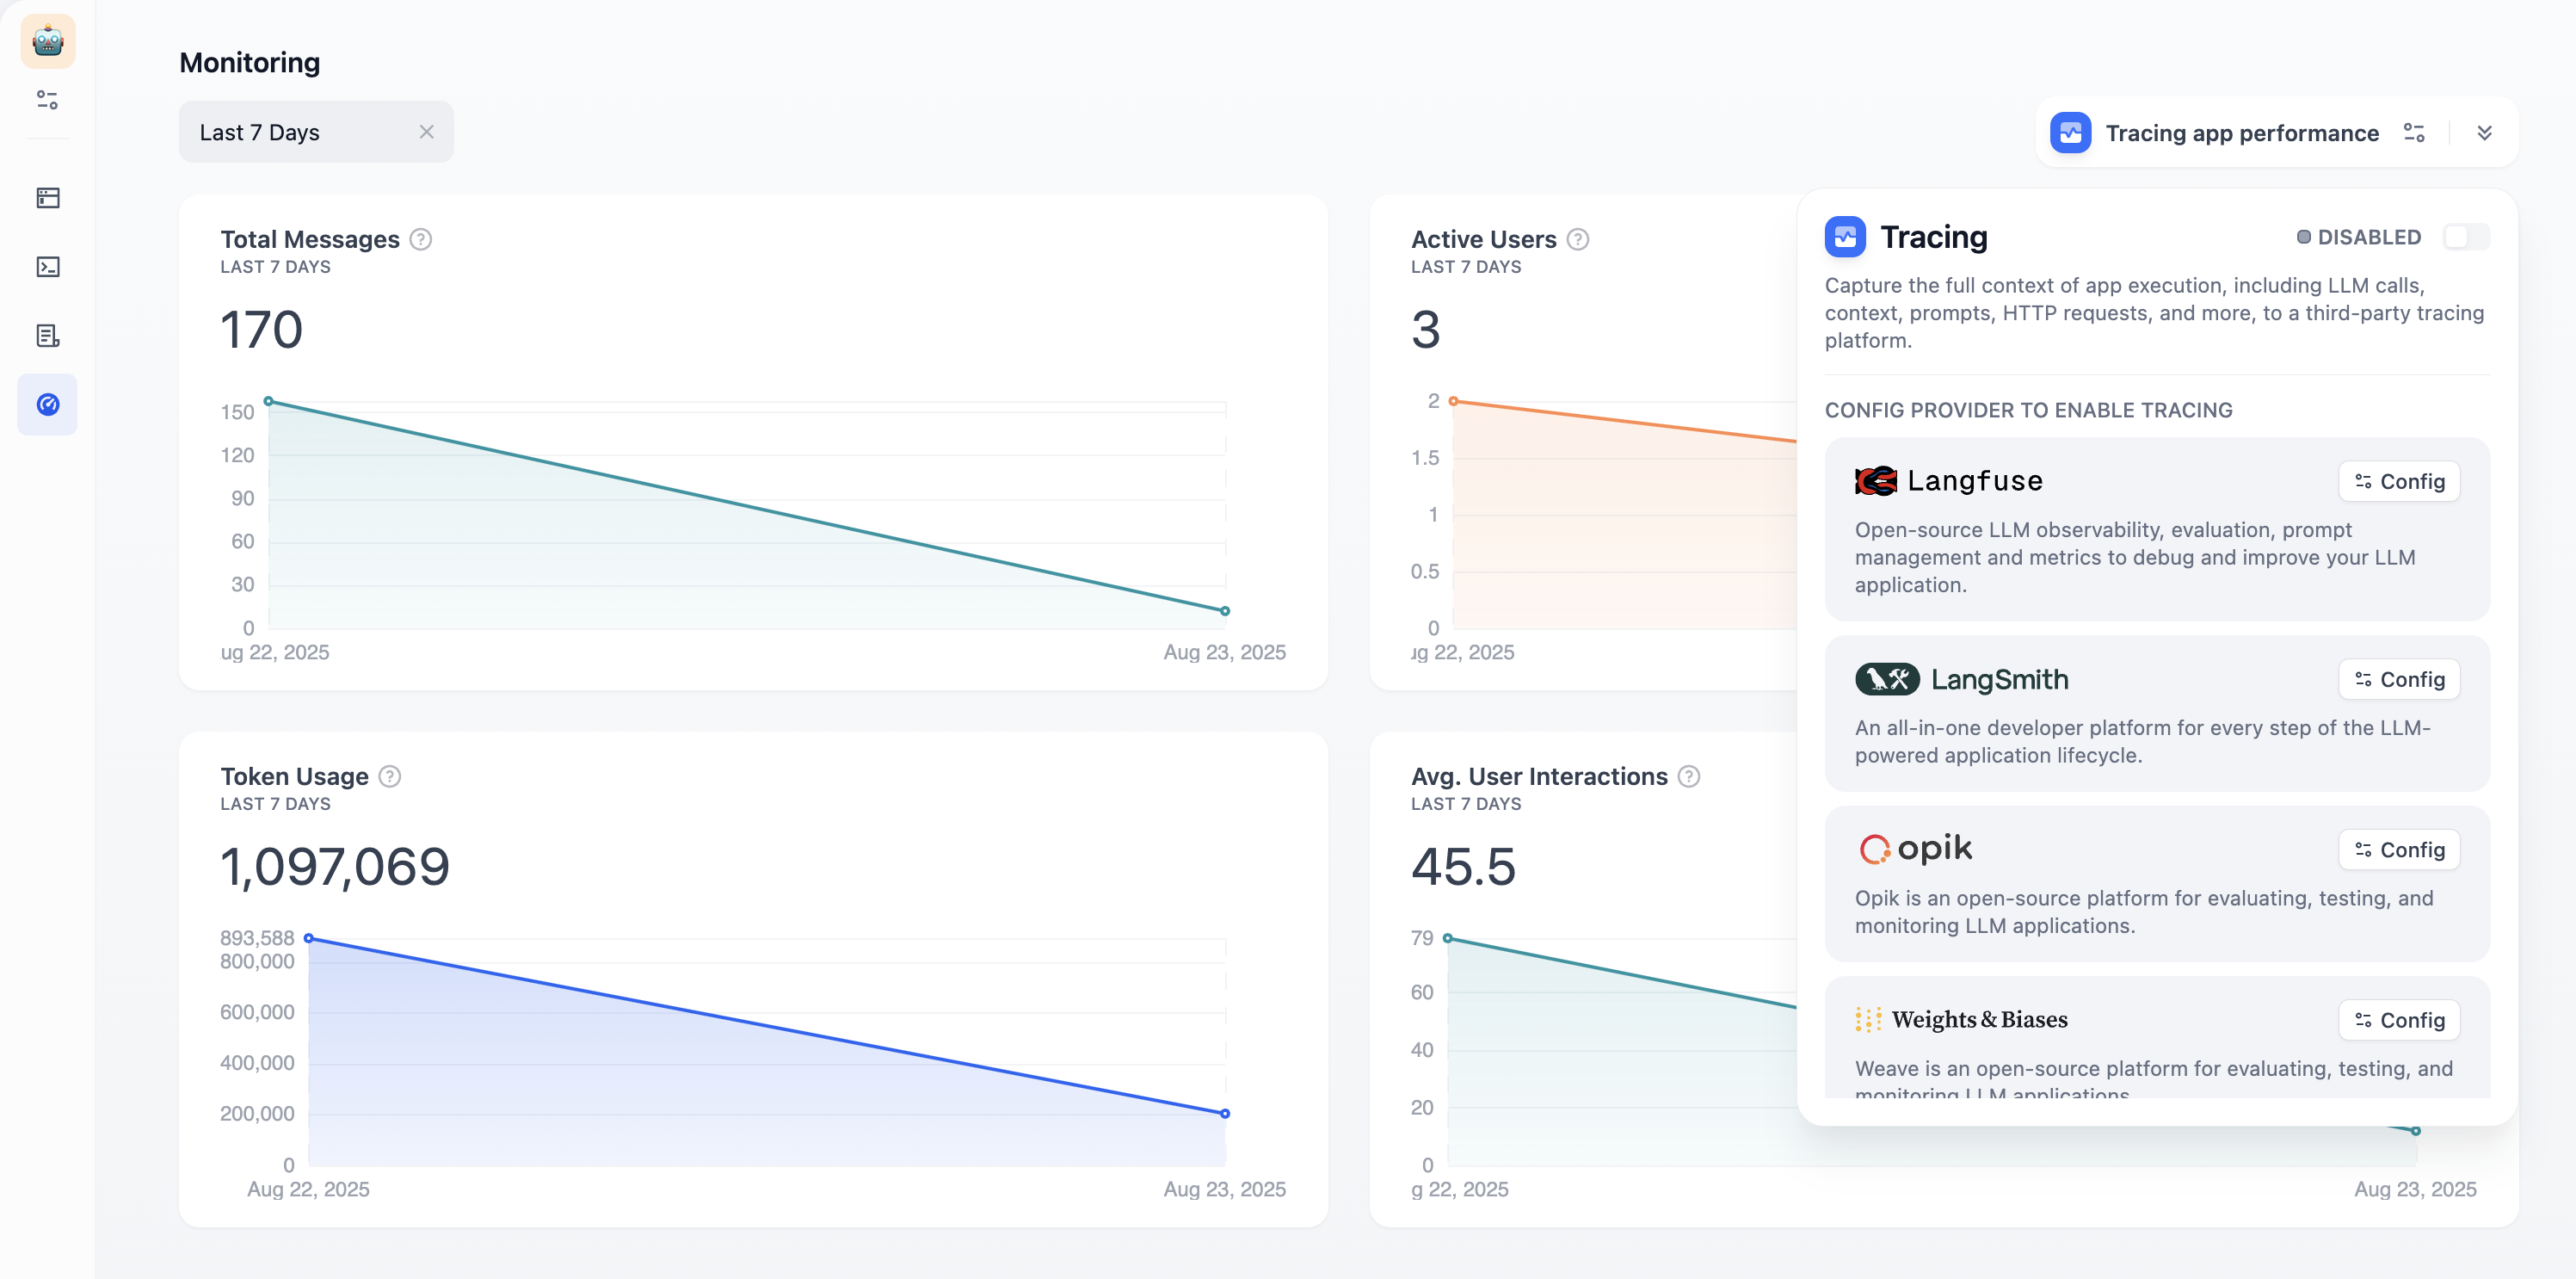 **Total Messages:** 对话量\
**Active Users:** 有意义互动的用户(多于一次的交互)\
**Average User Interactions:** 每次会话的参与深度\
**Token Usage:** 资源消耗和成本
使用时间选择器查看不同时间段的趋势。点击 **"Tracing app performance"** 以连接外部可观察性平台,如 Langfuse 或 LangSmith,以获得更深入的分析。
**Total Messages:** 对话量\
**Active Users:** 有意义互动的用户(多于一次的交互)\
**Average User Interactions:** 每次会话的参与深度\
**Token Usage:** 资源消耗和成本
使用时间选择器查看不同时间段的趋势。点击 **"Tracing app performance"** 以连接外部可观察性平台,如 Langfuse 或 LangSmith,以获得更深入的分析。